
Economic calendar
This week the most central banks decide policy rate, Tuesday is bank of Japan, Wednesday is Federal,Thursaday is Swiss national bank. wednesady will be a day where federal reserve will decide to hold interest on 4.50% or the will low interest rate because the inflation declined in May 2.4% compare for what the wall street expected to rise to 2.5%. I am expecting that the federal reserve will not change interest rate due to there is uncertainity in global economy from the trade war, effects of tariffs and the Iran and Israel Escalation.
GEOPOTICAL NEWS
We should know how Escalation tensions in the middle east coould affects the markets this week. The main focus is Iran and Israel focus.
I must focus and keep my eye on the strait of Hormuz closure because this use to supply 20% of total global crude oil. The shutdown of the strait of Hormuz could cause oil price to surge strongly.
DOLLAR
Dollar is in downtrend and the price is already on the weekly demand zone at 98. I am really looking the price moving upside toward at 98.600 based on the inflation is declining. The last weekly candle closed bullish so let wait how the market will react the on FMOC or Iran and Israel escalation. when the FED decide to low interest rate, DXY will fall strongly.
 |
| daily chart of Dollar |
EURUSD
The market is bullish because the weekly candle closed bullish and closed above the 1.1500 resistance. I keeps my eye on the support at1.1500 if the price hold this level the buyers will continue to move up, if the price come below the support sellers will be in the control. It is better to be mindful that this week is central bank policies, these decision can change any direction quickly.
 |
| EURUSD daily chart |
USDJPY
Tuesday there Bank of Japan Policy rate, We need to see how the market is will react on the policy rate decision of Japan. Technically the market is in the range between 146 and 142. Remember the breakout range from higher timeframes provide a strong move.
 |
| USDJPY daily chart |
GBPJPY
The usually has a strong supply zone at 196.1 from the weekly. The weekly candle closed with long lower wicks. I am waiting the price for breaking resistance for buying opportunity. Remember that this week is red any can change any time.
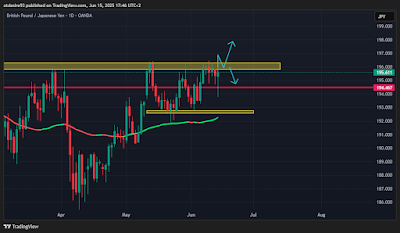 |
| GBPJPY daily chart |
Gold
Gold market is strongly bullish because the weekly candle closed supply zone at 3400. continuation of gold will hold because escalation and the uncertainity of the global economy. I keeps eye on the daily resistance at 3431, if price hold above will be a good signal of buying opportunity of this week
 |
| Gold daily chart |
OIL
OIL had a good week, because it broke the supply zone at 65.86 due to iran and israel escalation. the seller came in the market at 77. I am looking the oil continuarion upside whenever there is still conflicts in the middle east countries
 |
| oil daily chart |
SPX500
The market is still bullish but the last week is bearish because the conflict of the Iran and Israel. The price back on support at 5934. i am looking buyers to come in the market on this level.
 |
| SPX500 daily chart |
1. Reduce your size because this week will have high votility
2. Wait your setup
3. Trade what you see not what you think.
Lastly join our community and free mentorship starts from 11th July,2025
Join my Discord for daily analysis and Review
I wish a safe trading week and discipline


0 Comments